According to the latest data from the U.S. Census, at least 30% of households in 185 large and medium-size U.S. cities still lack a wireline broadband connection in 2019.
These are NDIA’s Worst Connected Cities of 2019.
Released by the U.S. Census Bureau in September 2020, the 2019 American Community Survey (ACS) One-Year Estimates includes household Internet access data for a total of 625 U.S. cities or Census designated places with populations of 65,000 or more.
NDIA has ranked all 625 of these communities by two categories:
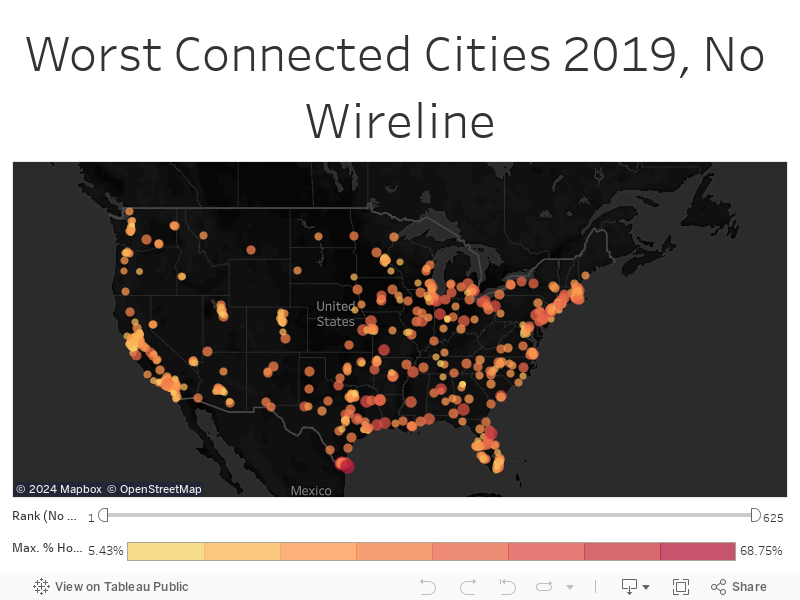
- the percentage of households without Wireline broadband subscriptions, defined by the ACS as “Broadband such as cable, fiber optic or DSL,” and
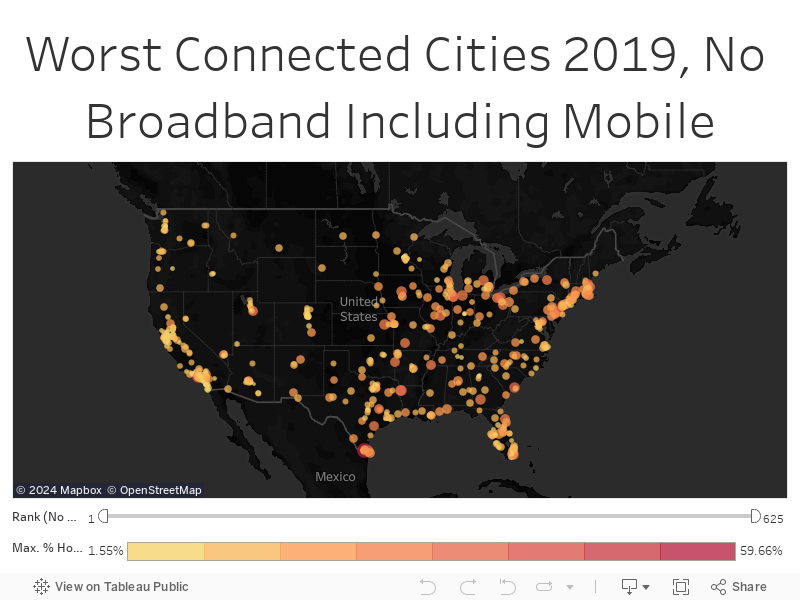
- the percentage of each community’s households that lacked broadband Internet subscriptions of any type, including mobile data plans.
The results can be seen in the interactive maps and table below.
Note that this data is not an indication of the availability of home broadband service, but rather of the extent to which households are actually connected to it.
All data is from Table B28002, “PRESENCE AND TYPES OF INTERNET SUBSCRIPTIONS IN HOUSEHOLD”, in the 2019 American Community Survey One-Year Estimates.
These interactive maps visualize two categories—the percentage of households with no wireline (cable, DSL, fiber), and the percentage of households with no broadband including mobile data plans.
In the table, red and yellow markers show cities with 65,000+ residents where at least 30% of all households were without cable, DSL or fiber Internet subscriptions in 2019. In the cities with red markers, at least one in five households lacked broadband subscriptions of any type, including cellular data plans.
Source: 2019 American Community Survey One Year Estimates, Table B28002