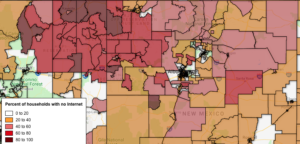
 NDIA today published six interactive maps showing the percentages of households with wireline broadband connections, and the percentage of households with no home Internet connection of any kind, for every Census tract in the United States.
The maps provide a uniquely detailed picture of the extent of home broadband connectivity, as well as the persistent gaps in that connectivity afflicting both rural areas and inner city neighborhoods throughout the nation.
NDIA’s maps are based on new data from the 2017 American Community Survey (ACS) 5-Year Estimates, released last Thursday by the U.S. Census.
“The ACS has been collecting large-scale survey information on household computer ownership and Internet access for the past five years, but until now that data has only been published for communities with populations of more than 20,000, and only at the community-wide level”, explained NDIA Executive Director Angela Siefer. “Now, for the first time, the Census is making this same data available for every Census tract in the country. This is an incredible new resource for people in city neighborhoods, small communities, rural and tribal areas to understand and address the broadband divides in our own diverse communities.
“NDIA staff has mapped two of the most significant data points from the new ACS Internet access tables. On the positive side, we show the percentage of households in each tract that are connected to the Internet by wireline technologies including cable, DSL and fiber to the home. On the less positive side, we show the percentage of households in each tract that lack any home Internet connection, including mobile Internet service or dial-up modems.
“We’re making these maps public as quickly as possible, to enable public officials, policy makers, community organizations, anchor institutions, media and ordinary citizens to start forming a more accurate picture of the real state of broadband access, and the true severity of the digital divide, close to home.”
