The American Community Survey (ACS) 2022 one-year estimates, which were released in September, reveal the impact of digital inclusion work and the disparities that still exist.
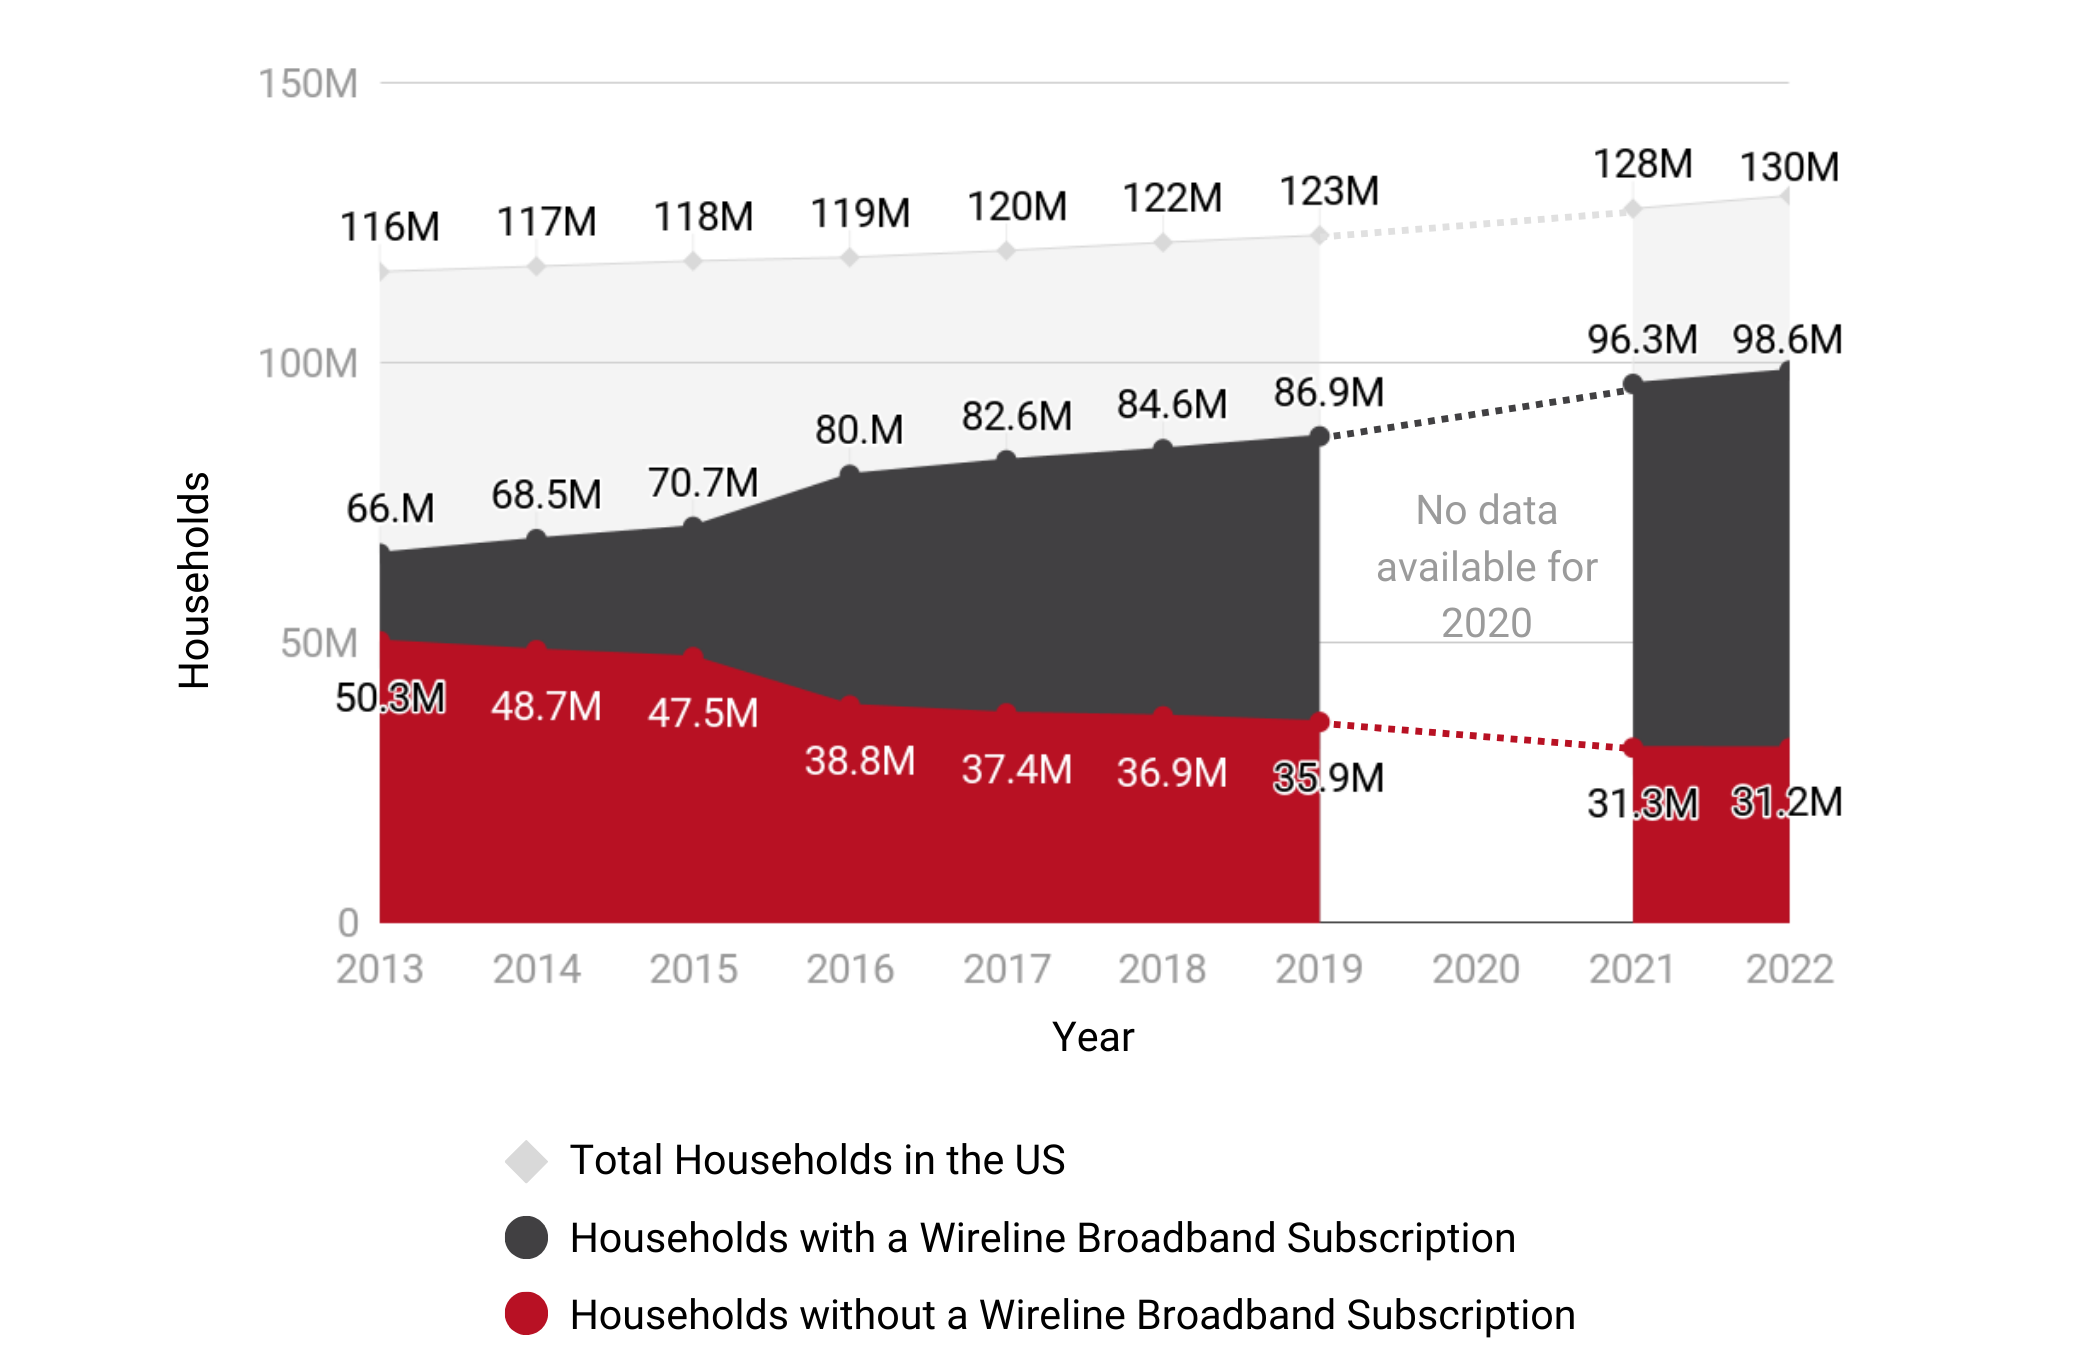
First, we have to celebrate the progress made in broadband adoption reflected in the 2022 data. From 2021 to 2022, 2.5 million new households subscribed to home internet (wireline broadband, which includes DSL, cable, or fiber connections).
While this is a huge number to celebrate, we should zoom out to look at how this compares to previous years. The biggest leap in home internet subscriptions in recent history is from 2019 to 2021, with 9.3 million new households connected. We don’t have ACS data for 2020 due to the COVID-19 pandemic; however, even if the number of new subscriptions were split evenly over two years, those would be the two highest increases since 2015-16. The pandemic shone a spotlight on the digital divide and the need for digital inclusion resources, but steady progress continues. In fact, the increase in home internet subscribers from 2021 to 2022 is right in line with the median increase of 2.4 million per year since 2013.
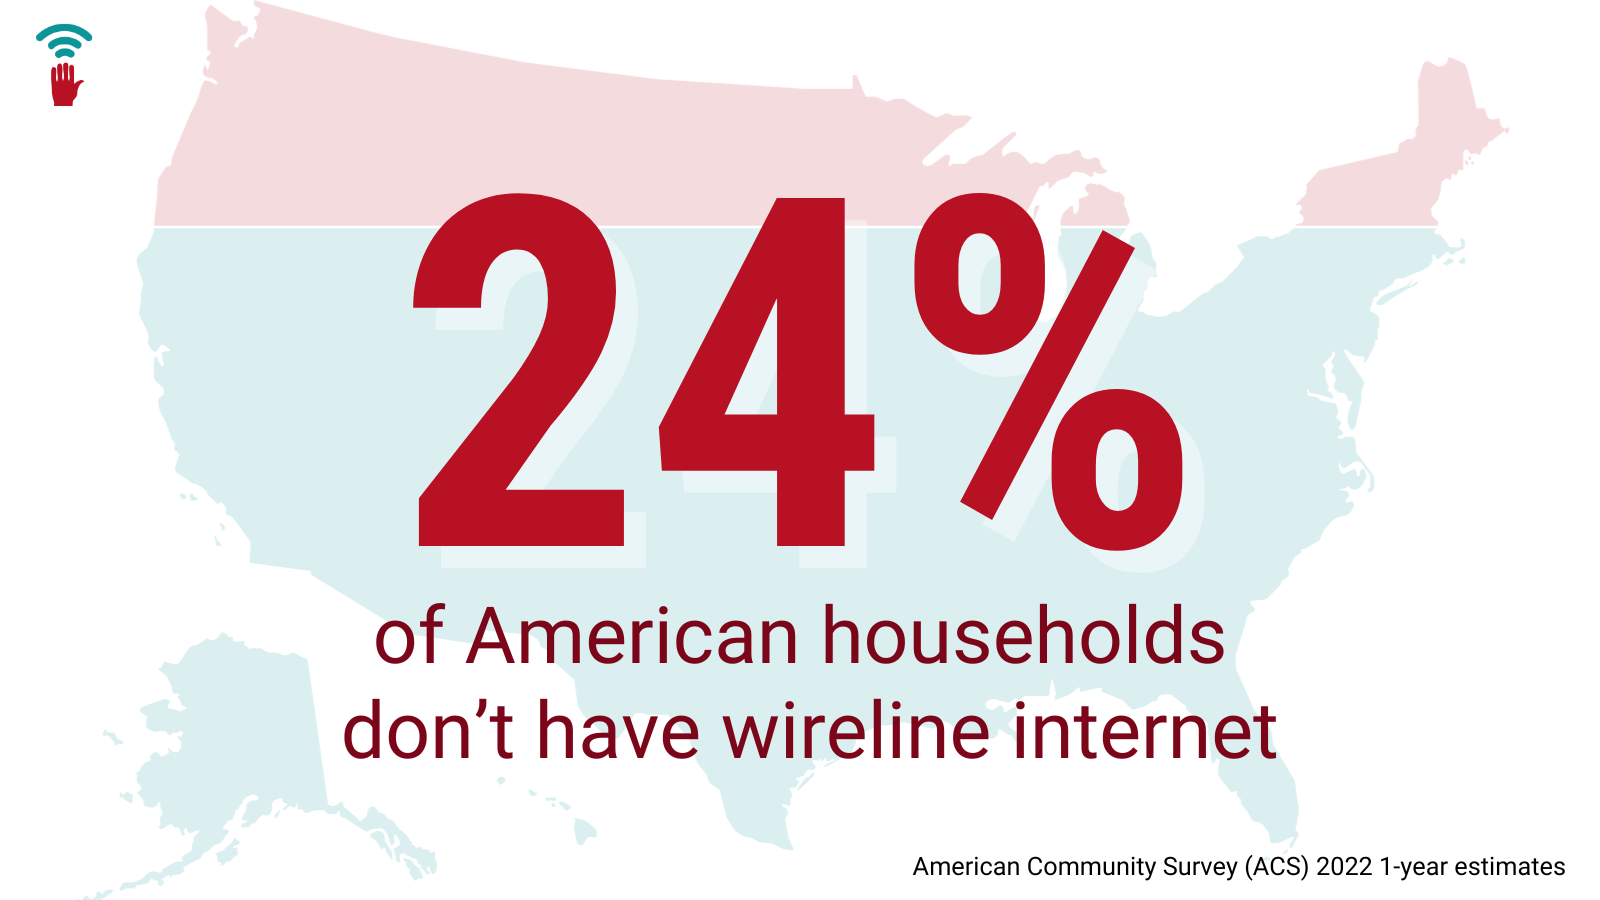
As we continue in this work, we have to acknowledge that gaps still exist. In 2022, 31.2 million households, nearly one-quarter of all US households, still did not have a home internet. More than 8 million American households, or a total of 6 percent, still had no connection to the internet at all – no home broadband, no mobile data plan, no satellite connection.
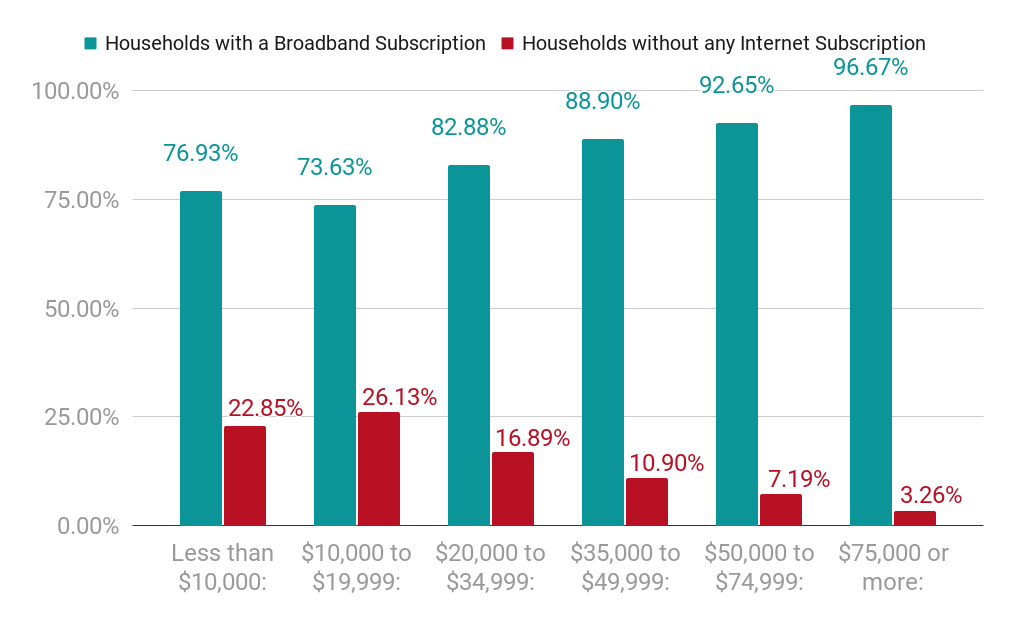
Unsurprisingly, income remained a strong predictor of internet adoption, with households in the highest income brackets having the highest broadband subscription rates. Based on a 2022 study by Consumer Reports, “the median cost of high-speed internet service was $74.99 per month.” To put that into perspective, that equates to at least 9 percent of monthly income for households in the lowest income bracket (those earning less than $10,000 per year).
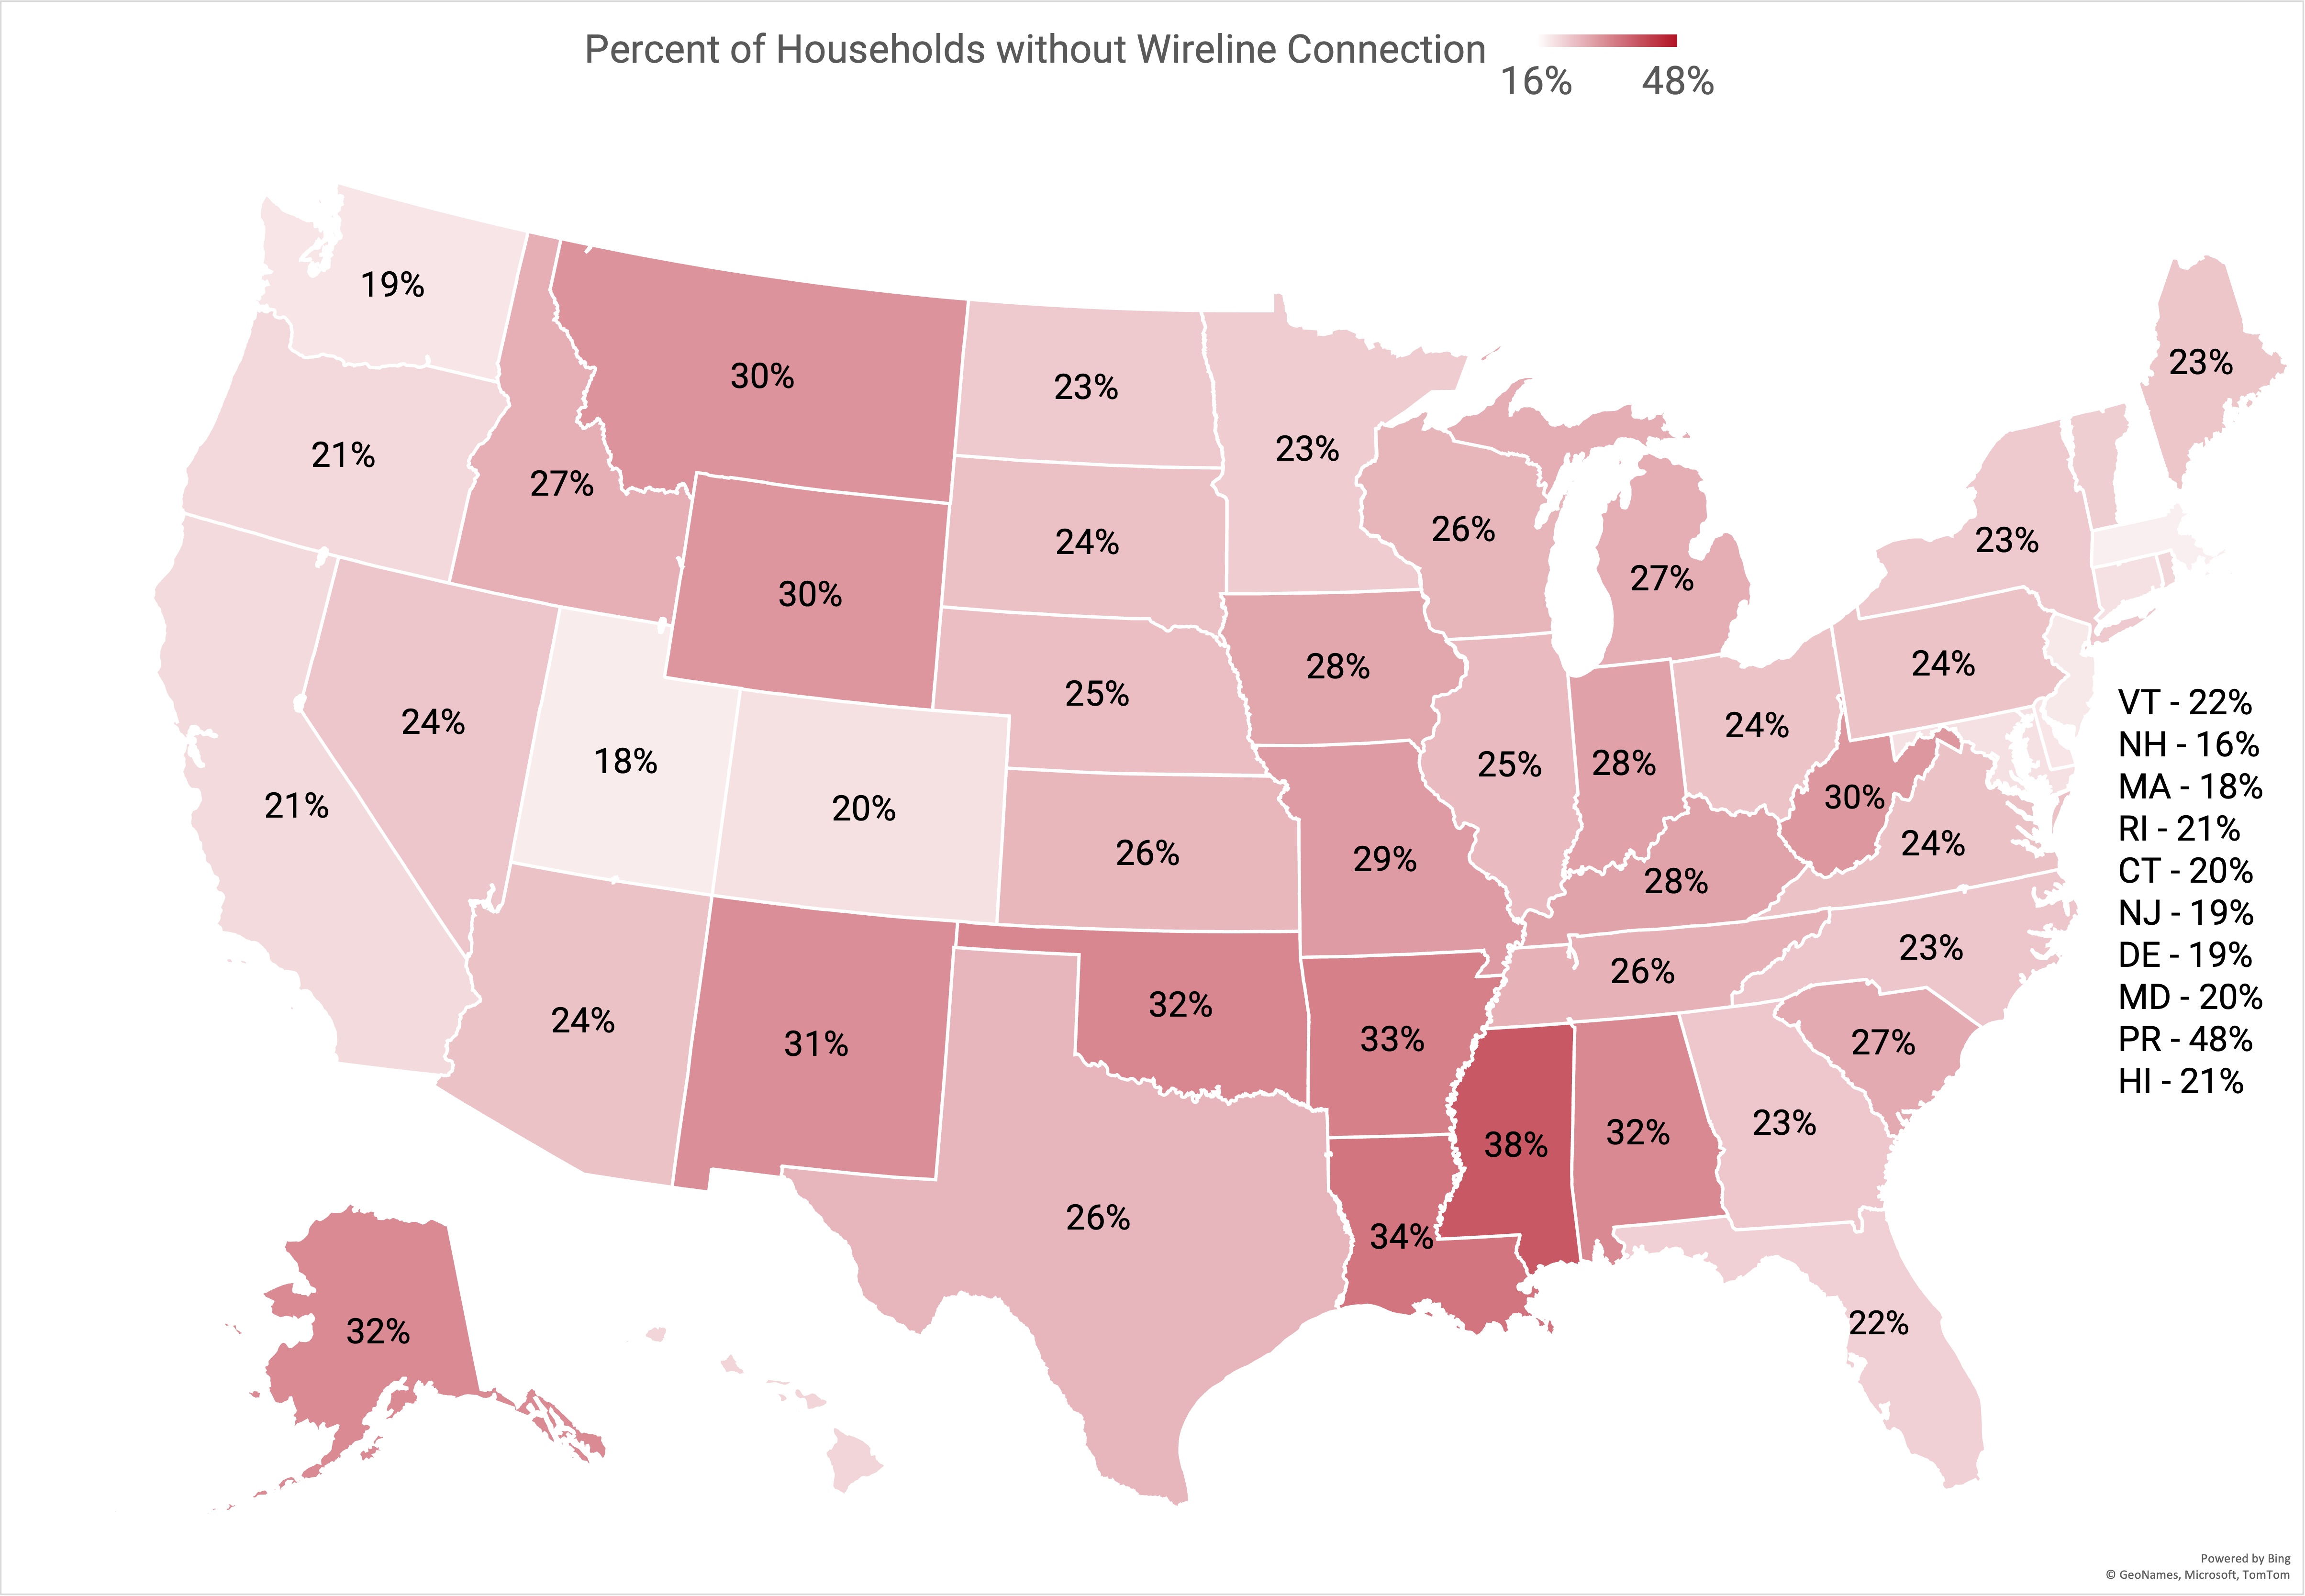
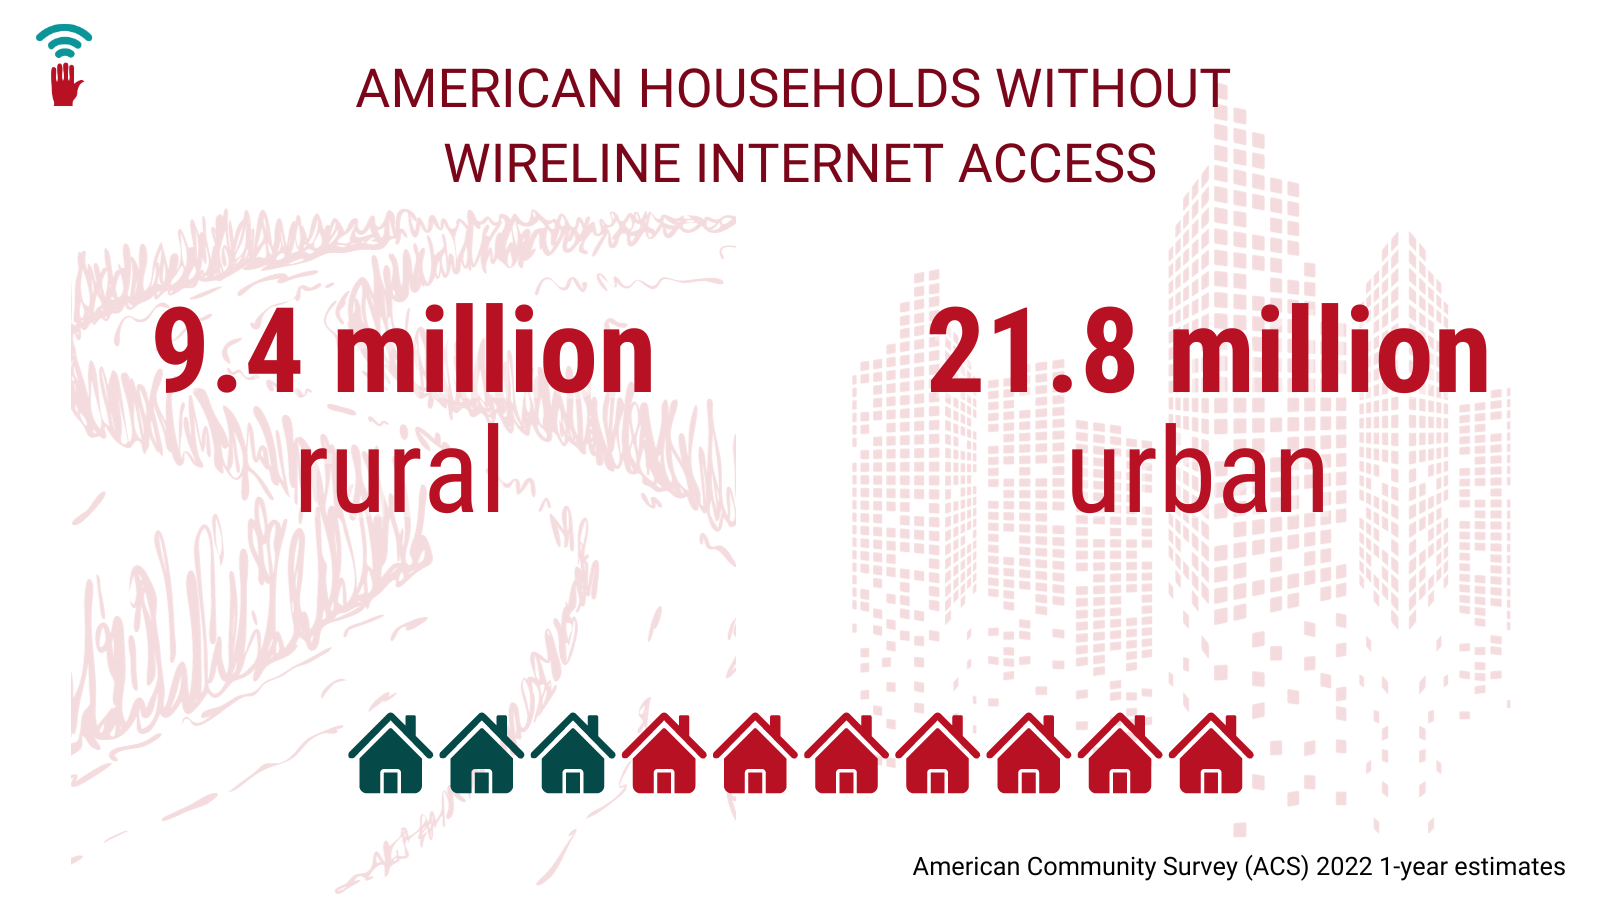
Some notable clusters of states with low connectivity were rural southern states, such as Louisiana, Alabama, Arkansas, and Oklahoma, and rural plains states, such as Montana, Wyoming, New Mexico, and then also Alaska. This is consistent with overall trends of rural and urban connectivity: 36 percent of rural households had no home internet compared to 21 percent of urban households. However, it is important to note that there were more than twice the number of unconnected urban households at 21.8 million compared to rural households at 9.4 million. While rural areas face a digital divide heavily influenced by infrastructure, millions more urban households remain unconnected. Since most unconnected households are in urban areas, these populations must be prioritized in efforts and funding to get everyone online. The unique barriers that affect urban connectivity also need to be addressed, including affordability, digital discrimination and redlining, and other adoption barriers
Turning our focus to racial inequities, we see the greatest disparities between the “haves” and “have-nots” in the percentage of white households who reported having a computer and home internet as compared to households that identify as Black, Indigenous, and Native Hawaiian or Pacific Islander.
This is an important reminder of the ongoing impact of racial discrimination, both discrete and structural, affecting who has access to the digital tools needed to live, learn, work, and thrive.
| Individual’s Racial or Ethnic Identity | Percentage of Individuals with Computer and Wireline Broadband Connection |
| American Indian or Native Alaskan | 88% |
| Black or African American | 90% |
| Native Hawaiian and Other Pacific Islander | 90% |
| Hispanic or Latino | 92% |
| White | 93% |
| Asian | 96% |
(Please note that the racial and ethnic designations listed here are from the ACS)
The 2022 ACS is the most current data available. This data is annual and high-level, but it helps us see important recent trends across the US.
As with any data source, it is important to keep in mind its limitations. The 1-year estimates are not available beyond the year 2013, and for geographies with fewer than 65,000 people, meaning that a lot of rural and Tribal populations may have difficulty finding accurate data for their communities.
We must also keep in mind that broadband adoption is not the end of the story. This data does not tell us anything about the quality or reliability of service. It also does not tell us about how individuals’ comfort and skill level individuals have in using their internet access. There are many scenarios beyond just adoption that, in practice, still present barriers to everyone being able to use technology to live, learn, work, and thrive.
The national trends presented in this blogpost may look different in your community, and we urge you to explore the data yourself. You can find data for your state or locality straight from data.census.gov and find out what the digital divide means for your work. There is a handy list of digital inclusion-related ACS tables on the NDIA Data & Research page.
For more detailed geographies and smaller communities, the five-year estimates come out in December, so keep a look out for updates.