Discover how digital equity leaders across the country are engaging with NDIA and navigating the changing landscape of our field. This webpage highlights the key findings from our first-ever community survey, with a link to the complete report below.
Insights from the Digital Inclusion Field
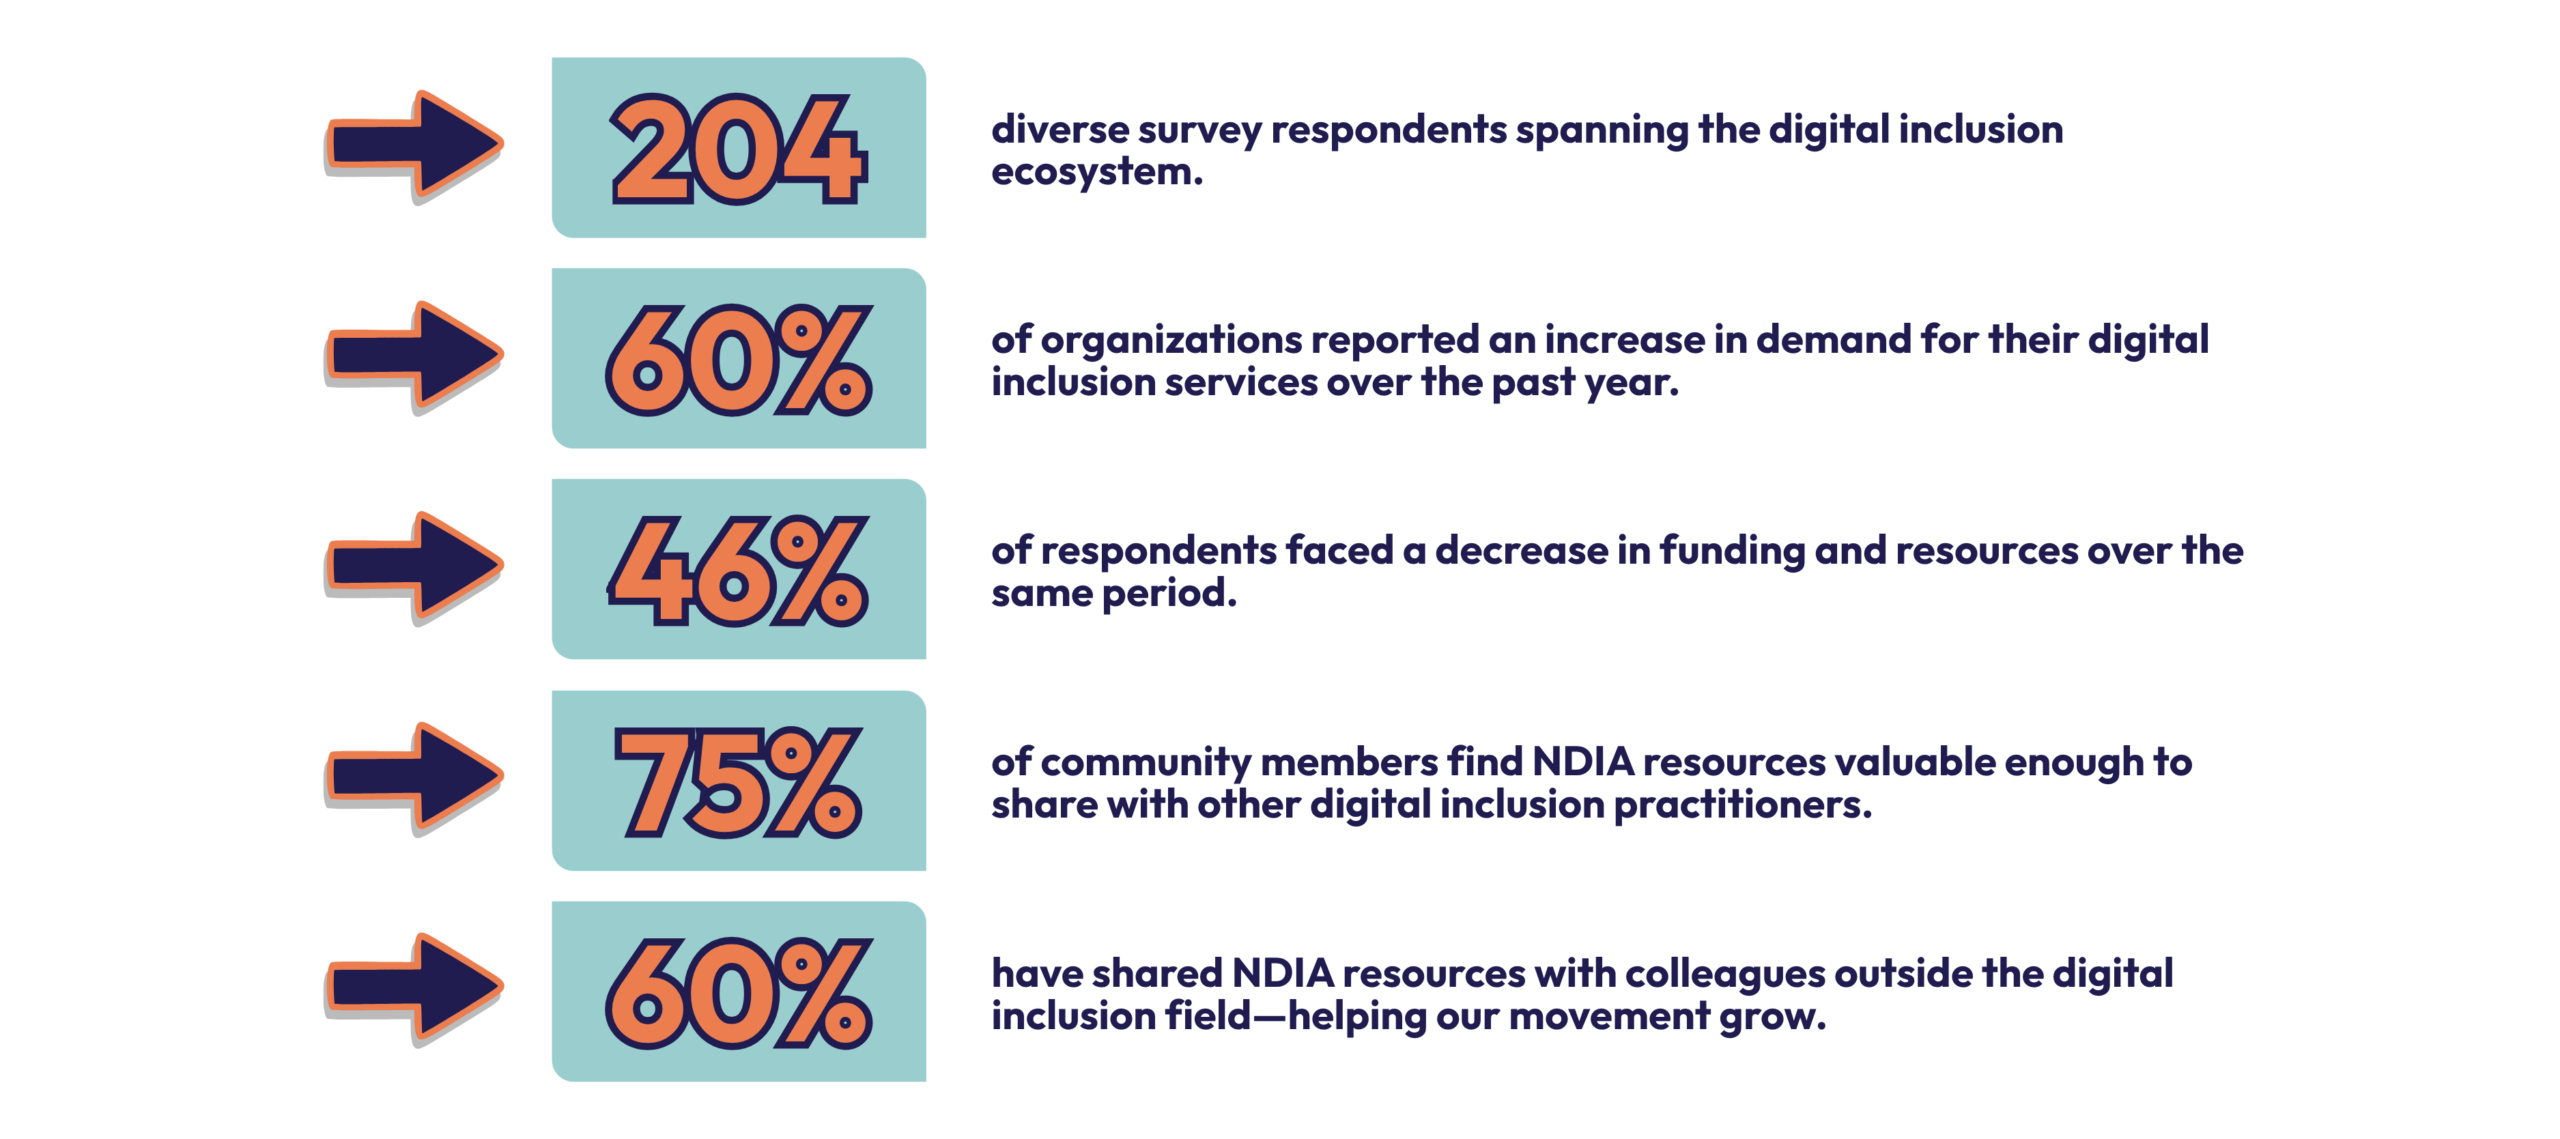
In the spring of 2026, NDIA launched its first-ever Community Survey. Our goal was simple: to better understand how individuals and organizations engage with our resources, map out the current landscape of digital inclusion work, and gather data to shape the future of our advocacy, tools, and support.
From grassroots nonprofits to local governments and libraries, our community spoke up. Here is a high-level look at what we learned about who you are, how you interact with NDIA, and the state of the digital inclusion field today.
Organization Types: About half of the responses came from nonprofits, followed by government (around 20%), libraries (around 10%), and higher education (8%).
Small but Mighty Teams: Nearly 60% of responding organizations operate with fewer than five people dedicated to digital inclusion work—including 18.1% who run a true one-person operation. Because of this, our community members frequently wear multiple hats, balancing leadership, programming, and direct service.
Geographic Focus: Nearly two-thirds of respondents focus their efforts locally or regionally within their state.
When asked to describe NDIA in their own words, one clear identity stood out: Advocate.
Our community also heavily emphasized our role as a partner, grouping advocacy with words like collaborative, inclusive, community-centered, and convener.
On a 5-point scale, respondents gave NDIA strong marks for alignment and impact:
4.4 / 5 for how well NDIA’s work reflects its mission and vision.
4.1 / 5 for the effectiveness of NDIA’s tools and resources in advancing digital equity.
4.0 / 5 for how closely NDIA’s work aligns with individual organizational needs.
The State of the Field: Widespread Demand, Shifting Resources
The digital inclusion ecosystem is experiencing a critical paradox: demand is rising, but funding is tightened. As federal and local public funding mechanisms (like ARPA and cable franchise fees) expire or diminish, sustainability is the top concern for the field.
The Top Barriers to Growth: Unsurprisingly, funding was named the #1 barrier to scaling impact, followed closely by staff capacity and the deprioritization of digital equity.
An Uncertain Outlook: Financial sustainability confidence is split down the middle, with 35.2% feeling positive, 36.2% feeling negative, and a sizable group (29%) feeling uncertain about the future.
How NDIA is stepping up: In response to these challenges, our community called on NDIA to “keep doing what you do,” with an even sharper focus on aggressive advocacy, impactful storytelling, and providing practitioner strategies to attract new funding.
Top Impact Resources
While all NDIA resources were rated highly, three categories stood out as “very impactful” over the last 12 months:
This snapshot is only the beginning. The insights gathered from this first annual survey will directly inform NDIA’s strategic direction, resource development, and advocacy efforts moving forward.
To see the complete breakdown of demographics, communication preferences, and community feedback, read the full report.
Across the country, older adults are struggling as they attempt to navigate telehealth appointments. Parents without affordable home internet options are seeing their children fall behind in school. Adult job seekers without digital skills are having difficulty competing in the online job market.
Stand with NDIA as we work to protect the essential investments that would advance digital access, skills, and opportunities for people and communities nationwide.