As our field continues to grow and mature, digital inclusion coalitions have emerged as a vehicle to organize practitioners, policymakers, and researchers under an umbrella that is suited to meet the urgent technology gaps in the communities that they serve.
Last fall, we opened a survey to gather information about how coalitions structure their work, how they are organized, and how they measure their impact.
Interactive Map and Visualizations, For You
Today, NDIA is thrilled to publish the first set of many resources and tools for our community that shine a light on the work of digital inclusion coalitions across the country.
We’re sharing an interactive map and visualizations of coalitions that feature a breakdown of 85 coalitions representing statewide, regional, and local (municipal and county) levels of geography. We recommend that you use these tools to gather contact information for any listed coalition to get connected with leaders across the country and learn more about their important work.
You can also use these tools for research purposes. Curious about the breakdown of state, regional, and local coalitions? Which state has the most coalitions? How many coalitions exist in a given state? We’ve included features within the map and the embedded table that allow you to cross-cut this rich trove of information in dozens of permutations.
These tools are for the NDIA community, and we’re looking forward to learning about the insights that you gather and hearing about the connections that you make through these resources.
Map of Place-Based Digital Inclusion Coalitions
What Did We Learn?
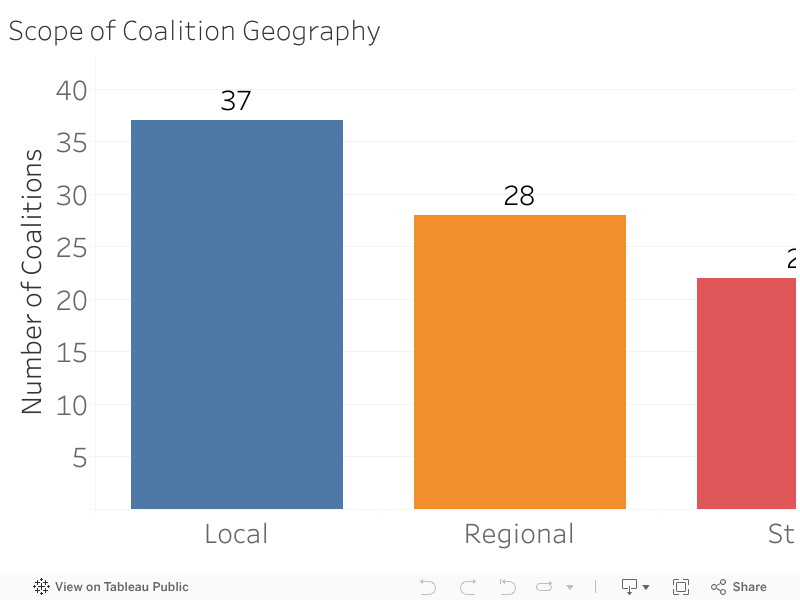
This is just our initial set of high-level takeaways with more to come over the coming months as we continue to dig deeper into the survey results. What we can tell you so far is that of the 85 coalitions that completed our survey:
- 37 coalitions represent cities, Metropolitan Statistical Areas, and/or counties,
- 28 coalitions represent regional geographies (such as the Mohawk Valley Broadband Coalition in New York, which covers multiple counties), and
- 22 coalitions (including three in Arizona) represent entire states.
Select any of the interactive visualizations below to open a tooltip box that will filter the information for you.
Currently, New York State (10) has the most coalitions with California (8), and Maine (7) not far behind.

And, we have at least one additional way to measure the impact of COVID on the growth of our field. A staggering 65 digital inclusion coalitions have been formed since 2020.

How Did We Do This?
These tools and the information that they contain are the results of a survey of coalitions, which was open for eight weeks during Fall 2024. We shared the survey through our listserv, partner networks, and social media.
After we complete our analysis of the rest of the survey, we intend to re-open the survey later this year so that we can continue to gather coalition information and update these tools. Note that this is not a complete count of all digital inclusion coalitions in the country, yet it provides an important snapshot of those that completed this survey.
What’s Next?
We have already learned a great deal of information about staffing, sources of funding, and various models of organization, which we will continue to analyze and share findings leading up to Net Inclusion 2025. We’ll publish the full Coalition survey results with more tools and visualizations in a storymap when the analysis is finished.